

Gold Symetrical Triangle On Daily Timeframe On 4 Sep 2020
In Daily Timefram Gold Has Created A Symetrical Triangle Following A Bullish Move And Expectations For This Symetrical Triangle Is Still Bullish And If Market Breaks To The Up Site It Can Hit The Target Of 2100 and 2200.
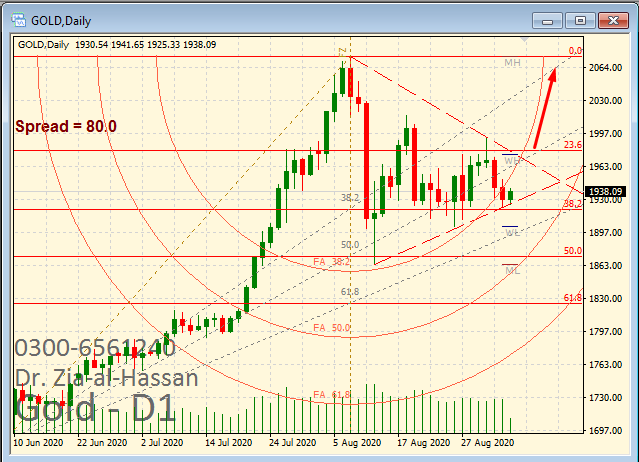
Analysis Done On 04 September 2020 On Gold Daily Chart

Gold Triangle Analysis On TradingView.Com
Related Links
Free Forex Daily Trading Signals | Free Forex Technical Analysis | Free Forex Webinars | Top Free Forex Strategies | Free Forex Training Course | List Of All Available Courses At Digital Technologies Pakistan